import pandas as pd
import dabest
from palmerpenguins import load_penguins
Pre-compiling numba functions for DABEST...Compiling numba functions: 100%|████████████████| 11/11 [00:00<00:00, 67.69it/s]Numba compilation complete!DABEST is a package that performs estimation statistics available on Python and R. With Jupyter Notebook you can try DABEST-Python.
import pandas as pd
import dabest
from palmerpenguins import load_penguinsPre-compiling numba functions for DABEST...Compiling numba functions: 100%|████████████████| 11/11 [00:00<00:00, 67.69it/s]Numba compilation complete!penguins = load_penguins()
# If you had trouble installing the penguins package, you can also read in the data from the csv file by uncommenting the line below.
# penguins = pd.read_csv("penguins.csv")penguins.head()| species | island | bill_length_mm | bill_depth_mm | flipper_length_mm | body_mass_g | sex | year | |
|---|---|---|---|---|---|---|---|---|
| 0 | Adelie | Torgersen | 39.1 | 18.7 | 181.0 | 3750.0 | male | 2007 |
| 1 | Adelie | Torgersen | 39.5 | 17.4 | 186.0 | 3800.0 | female | 2007 |
| 2 | Adelie | Torgersen | 40.3 | 18.0 | 195.0 | 3250.0 | female | 2007 |
| 3 | Adelie | Torgersen | NaN | NaN | NaN | NaN | NaN | 2007 |
| 4 | Adelie | Torgersen | 36.7 | 19.3 | 193.0 | 3450.0 | female | 2007 |
penguins_analyse = dabest.load(data=penguins,
                           x="species", y="bill_length_mm",
                           idx=("Adelie", "Chinstrap", "Gentoo")
)penguins_analyse.mean_diffDABEST v2025.03.27
==================
Good evening!
The current time is Thu Mar 27 23:02:20 2025.
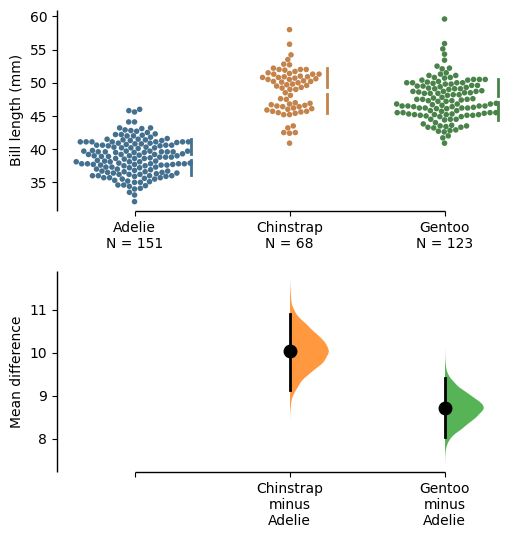
The unpaired mean difference between Adelie and Chinstrap is 10.0 [95%CI 9.14, 11.0].
The p-value of the two-sided permutation t-test is 0.0, calculated for legacy purposes only.
The unpaired mean difference between Adelie and Gentoo is 8.71 [95%CI 8.02, 9.42].
The p-value of the two-sided permutation t-test is 0.0, calculated for legacy purposes only.
5000 bootstrap samples were taken; the confidence interval is bias-corrected and accelerated.
Any p-value reported is the probability of observing theeffect size (or greater),
assuming the null hypothesis of zero difference is true.
For each p-value, 5000 reshuffles of the control and test labels were performed.
To get the results of all valid statistical tests, use `.mean_diff.statistical_tests`penguins_analyse.mean_diff.plot(raw_marker_size = 1.5, fig_size=(7, 7), raw_label="Bill length (mm)")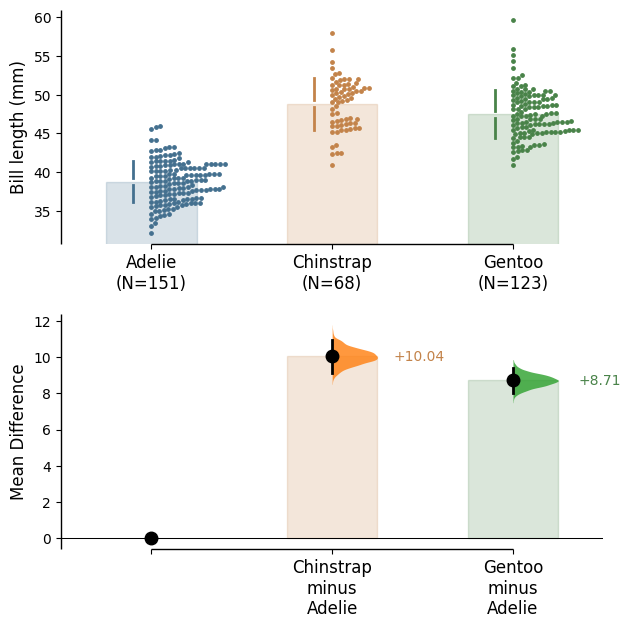
# penguins.dropna().melt(id_vars="species", value_vars="metric").head()The DABEST library has also been developed into a web application at estimationstats.com