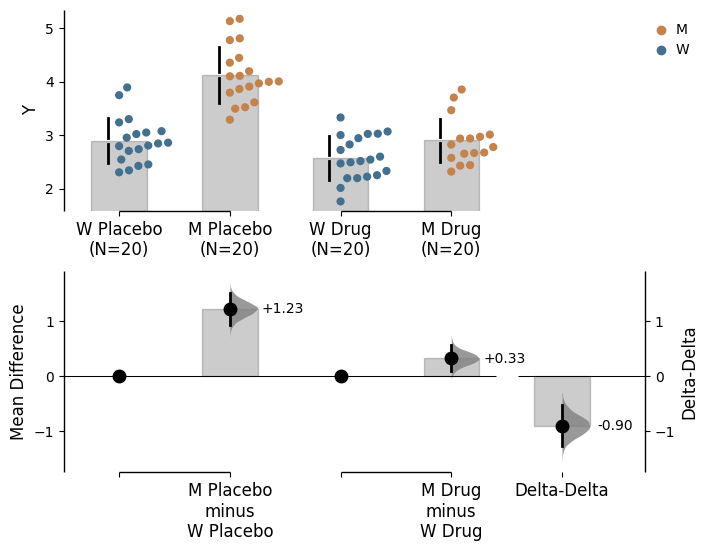
A class to compute and store the delta-delta statistics for experiments with a 2-by-2 arrangement where two independent variables, A and B, each have two categorical values, 1 and 2. The data is divided into two pairs of two groups, and a primary delta is first calculated as the mean difference between each of the pairs:
where \(\overline{X}_{A_{i}, B_{j}}\) is the mean of the sample with A = i and B = j, \(\Delta\) is the mean difference between two samples.
A delta-delta value is then calculated as the mean difference between the two primary deltas:
\[\Delta_{\Delta} = \Delta_{2} - \Delta_{1}\]
and a delta g value is calculated as the mean difference between the two primary deltas divided by the standard deviation of the delta-delta value, which is calculated from a pooled variance of the 4 samples:
where \(s\) is the standard deviation and \(n\) is the sample size.
Example: delta-delta
np.random.seed(9999) # Fix the seed so the results are replicable.N =20# Create samplesy = norm.rvs(loc=3, scale=0.4, size=N*4)y[N:2*N] = y[N:2*N]+1y[2*N:3*N] = y[2*N:3*N]-0.5# Add a `Treatment` columnt1 = np.repeat('Placebo', N*2).tolist()t2 = np.repeat('Drug', N*2).tolist()treatment = t1 + t2 # Add a `Rep` column as the first variable for the 2 replicates of experiments donerep = []for i inrange(N*2): rep.append('Rep1') rep.append('Rep2')# Add a `Genotype` column as the second variablewt = np.repeat('W', N).tolist()mt = np.repeat('M', N).tolist()wt2 = np.repeat('W', N).tolist()mt2 = np.repeat('M', N).tolist()genotype = wt + mt + wt2 + mt2# Add an `id` column for paired data plotting.id=list(range(0, N*2))id_col =id+id# Combine all columns into a DataFrame.df_delta2 = pd.DataFrame({'ID' : id_col,'Rep' : rep,'Genotype' : genotype, 'Treatment': treatment,'Y' : y })unpaired_delta2 = dabest.load(data = df_delta2, x = ["Genotype", "Genotype"], y ="Y", delta2 =True, experiment ="Treatment")unpaired_delta2.mean_diff.plot();
C:\Users\maiyi\anaconda3\Lib\site-packages\dabest\plot_tools.py:2537: UserWarning: 5.0% of the points cannot be placed. You might want to decrease the size of the markers.
  warnings.warn(err)
C:\Users\maiyi\anaconda3\Lib\site-packages\dabest\plot_tools.py:2537: UserWarning: 5.0% of the points cannot be placed. You might want to decrease the size of the markers.
  warnings.warn(err)
C:\Users\maiyi\anaconda3\Lib\site-packages\dabest\plot_tools.py:2537: UserWarning: 20.0% of the points cannot be placed. You might want to decrease the size of the markers.
  warnings.warn(err)
DABEST v2025.03.27
==================

Good afternoon!
The current time is Mon Sep  1 16:03:47 2025.

The weighted-average unpaired mean differences is 0.0336 [95%CI -0.136, 0.236].
The p-value of the two-sided permutation t-test is 0.736, calculated for legacy purposes only.

5000 bootstrap samples were taken; the confidence interval is bias-corrected and accelerated.
Any p-value reported is the probability of observing theeffect size (or greater),
assuming the null hypothesis of zero difference is true.
For each p-value, 5000 reshuffles of the control and test labels were performed.
As of version 2023.02.14, weighted delta can only be calculated for mean difference, and not for standardized measures such as Cohen’s d.
Details about the calculated weighted delta are accessed as attributes of the mini_meta class. See the minimetadelta for details on usage.
Refer to Chapter 10 of the Cochrane handbook for further information on meta-analysis: https://training.cochrane.org/handbook/current/chapter-10